|
This lesson was difficult because I am least familiar with excel. I included a word document as I put most of my instructions and follow up questions in that because I was unsure of how to format such long sentences in excel. I like all of the manipulations you can do to graphs. I think it keeps them more entertaining than textbook graphs and also helps visual learners read data.
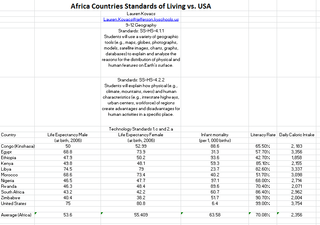
I am curious to see how the students manipulate excel when doing this project since they all take computers freshman year. Regardless, I think this would be a good reminder of ways to spice up their class presentations! The activity will also get them thinking about larger issues such as what causes African countries to have such high numbers of infant mortality and low literacy. Students can also work on geography in a context other than looking at a map. |
|
|
||||
